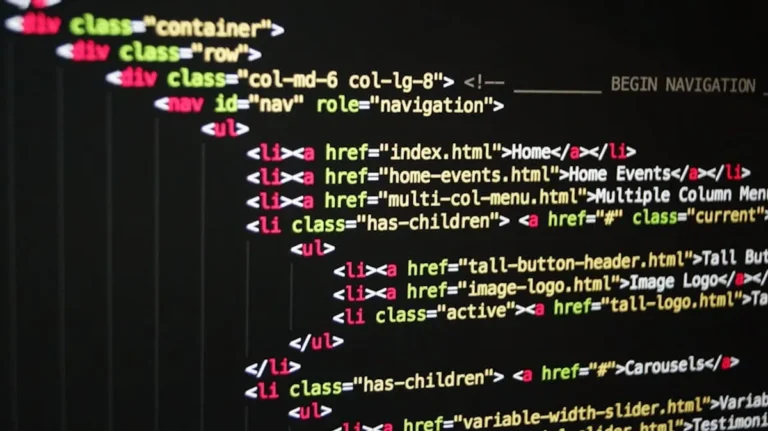

For site owners, marketers, and SEO professionals, the browser’s developer tools are not just for developers. These built-in utilities offer a direct window into how a website functions, performs, and presents itself to users and search engines. Understanding even a few core features can unlock significant diagnostic capabilities, allowing you to identify and resolve common issues impacting user experience, page speed, and ultimately, search visibility. Instead of relying solely on third-party tools for every insight, mastering these browser-native functions provides immediate, real-time feedback on your site’s health and structure. This direct access facilitates quicker problem identification, more informed decision-making, and a deeper understanding of the technical underpinnings that drive effective online presence.
Navigating DevTools: What Beginners Should Prioritize
Beginning with browser DevTools can feel overwhelming due to the sheer volume of panels and options available. For those focused on commercial outcomes—like improved SEO, faster load times, or better user engagement—the initial learning curve should prioritize features that offer immediate, actionable insights into a website's live state. Focus on panels that directly expose HTML structure, CSS styling, network requests, and performance metrics. These areas provide the most direct correlation to common website issues that impact search engine rankings and conversion rates. Prioritizing these foundational tools allows you to quickly diagnose problems like slow-loading images, broken links, unoptimized content, or unresponsive designs, without needing to delve into complex JavaScript debugging or advanced rendering analysis. The goal is to gain practical diagnostic skills that translate directly into tangible site improvements.
1. Elements Panel (Inspect HTML/CSS)
The Elements panel provides a live, interactive view of a webpage's Document Object Model (DOM), allowing you to inspect and modify HTML and CSS in real-time. This is fundamental for understanding how content is structured, what styles are applied, and how changes would impact visual presentation. For SEO, it's crucial for verifying heading structures (H1-H6), identifying issues with meta tags, checking image alt attributes, and ensuring content is rendered as expected by search engine crawlers. Marketers can use it to test different call-to-action button styles or text variations without deploying changes to a live server, offering immediate visual feedback on design adjustments.
Best for: On-page SEO audits, content structure verification, live CSS modification testing, identifying rendering issues, validating accessibility attributes.
Pros:
- Real-time HTML and CSS editing for immediate visual feedback.
- Direct visibility into the rendered DOM, including dynamically loaded content.
- Ability to inspect computed styles, event listeners, and layout properties.
- Essential for debugging visual glitches and layout problems.
Cons:
- Changes are not persistent; they reset on page reload.
- Can be overwhelming with complex DOM structures.
- Doesn't show server-side rendering issues directly.
Verdict: This is the entry point for most DevTools users and indispensable for anyone needing to understand or debug a page's visual and structural elements. Its utility for on-page SEO and design iteration makes it a top priority for beginners.
2. Console Panel (Error Checking & JavaScript Execution)
The Console panel serves as a command-line interface and a log viewer, displaying JavaScript errors, network request failures, security warnings, and custom messages from your code. For beginners, it's primarily a diagnostic tool to catch critical issues that could break site functionality or prevent content from loading. JavaScript errors, in particular, can hinder user interactions, prevent forms from submitting, or even block content from being indexed by search engines. Monitoring the console for red error messages offers immediate insight into client-side problems that demand attention.
Best for: Identifying JavaScript errors, network request failures, security warnings, debugging client-side script issues, quick command execution.
Pros:
- Immediate notification of critical client-side errors.
- Ability to execute JavaScript commands for testing and debugging.
- Provides context for network and security issues.
- Essential for understanding user-facing functionality problems.
Cons:
- Can display a high volume of benign warnings, requiring careful filtering.
- Doesn't directly diagnose server-side logic errors.
- Understanding error messages often requires basic JavaScript knowledge.
Verdict: A non-negotiable tool for basic site health checks. Catching errors here can prevent significant user experience degradation and potential SEO penalties related to broken functionality.
3. Network Panel (Page Load Analysis)
The Network panel records and displays all network requests made by a webpage, including HTML documents, CSS files, JavaScript, images, and fonts. It provides critical data on load times, resource sizes, and request order. For SEO and performance optimization, this panel is invaluable for identifying slow-loading assets, unnecessary requests, or blocking resources that delay content rendering. Marketers can use it to verify that tracking scripts and third-party integrations are loading efficiently without negatively impacting page speed metrics, which directly influence user retention and search rankings.
Best for: Diagnosing page load speed issues, identifying large assets, verifying resource loading order, checking HTTP status codes, monitoring tracking script performance.
Pros:
- Detailed breakdown of every resource loaded on a page.
- Visual waterfall chart for understanding request dependencies and timing.
- Filters for specific resource types (images, JS, CSS).
- Helps identify render-blocking resources and potential optimization targets.
Cons:
- Can be overwhelming with many requests on complex pages.
- Requires understanding of HTTP status codes and web performance concepts.
- Doesn't simulate real-world network conditions without throttling.
Verdict: Absolutely critical for performance optimization. Any site owner or marketer concerned with page speed and user experience will find this panel indispensable for uncovering bottlenecks.
4. Lighthouse Panel (Audits & Scores)
The Lighthouse panel (often labeled 'Audits' in older versions) provides automated reports on a page's performance, accessibility, best practices, SEO, and Progressive Web App (PWA) readiness. It runs a series of tests and generates a score for each category, along with specific recommendations for improvement. For beginners, Lighthouse offers a high-level, actionable checklist of areas to address, translating complex web standards into digestible tasks. It's an excellent starting point for identifying significant issues that impact search rankings and user satisfaction without requiring deep technical knowledge.
Best for: Quick, comprehensive site health checks, identifying major performance and SEO issues, getting actionable improvement suggestions, benchmarking against web vitals.
Pros:
- Automated, standardized reporting across multiple key areas.
- Provides clear, prioritized recommendations with links to documentation.
- Offers a quantitative score for tracking improvements over time.
- Excellent for identifying low-hanging fruit for optimization.
Cons:
- Scores can vary slightly between runs and network conditions.
- Recommendations are sometimes generic and require further investigation.
- Doesn't always capture all real-world user experience nuances.
Verdict: An essential first stop for any beginner looking to improve a website. Lighthouse provides a structured roadmap for enhancing a site's technical foundation and addressing critical user experience factors.
5. Device Mode (Responsive Design Testing)
Device Mode simulates how a webpage appears and functions on various mobile devices and screen sizes. This feature allows you to test responsive layouts, touch interactions, and mobile-specific CSS without needing a physical device. With mobile-first indexing being standard, ensuring a site is fully responsive and user-friendly on smaller screens is paramount for SEO and conversion rates. Marketers can use this to quickly verify that their content, calls-to-action, and navigation are accessible and appealing across the mobile spectrum.
Best for: Testing responsive web design, verifying mobile user experience, ensuring content readability on small screens, debugging mobile-specific CSS issues, checking touch target sizes.
Pros:
- Instant switching between popular device viewports.
- Ability to simulate touch events and device orientation.
- Network throttling options to test performance on slower mobile connections.
- Crucial for optimizing for mobile-first indexing.
Cons:
- Simulation is not 100% identical to a physical device (e.g., GPU rendering).
- Doesn't account for all browser-specific rendering differences.
- Can be challenging to test complex mobile gestures.
Verdict: Indispensable for modern web development and SEO. Given the dominance of mobile browsing, ensuring a flawless mobile experience is a prerequisite for online success, and Device Mode facilitates this directly.
6. Performance Monitor (Real-time Metrics)
The Performance Monitor provides a real-time graph of various performance metrics, including CPU usage, JavaScript heap size, DOM nodes, listeners, and layout recalculations. While the full Performance panel can be complex, the Monitor offers a simpler, continuous view of key resource consumption. For beginners, it's a quick way to spot spikes in CPU or memory usage that might indicate inefficient scripts or resource-heavy animations. This can help identify areas contributing to a sluggish user experience without diving into deep profiling.
Best for: Quick real-time performance checks, identifying immediate resource hogs, monitoring CPU and memory usage during interactions, spotting performance regressions.
Pros:
- Provides continuous, live feedback on critical performance indicators.
- Simpler interface than the full Performance panel for quick diagnostics.
- Helps correlate user interactions with resource consumption.
- Good for identifying general areas of performance concern.
Cons:
- Doesn't offer detailed flame charts or call trees for deep analysis.
- Requires some understanding of what "normal" resource usage looks like.
- Not suitable for pinpointing exact code-level bottlenecks.
Verdict: A useful lightweight tool for ongoing performance vigilance. It provides enough data for beginners to identify when and where performance issues might be occurring, prompting further investigation.
7. Application Panel (Cookies, Local Storage, Cache)
The Application panel allows you to inspect, modify, and delete various client-side storage mechanisms, including cookies, local storage, session storage, and cache. For marketers and site owners, understanding how a site uses these can be critical for debugging user sessions, tracking data, and ensuring compliance with privacy regulations. It helps verify if user preferences are being saved correctly, if tracking IDs are persistent, or if outdated cached resources are causing display issues. This panel offers direct insight into how a site manages user-specific data on the client side.
Best for: Debugging user sessions, verifying cookie and local storage data, managing cached resources, checking service worker status, ensuring privacy compliance related to client-side data.
Pros:
- Direct access to client-side data storage for inspection and modification.
- Helps debug user-specific issues like login problems or persistent preferences.
- Allows clearing cache and storage to simulate first-time user experiences.
- Useful for understanding how tracking scripts manage user identifiers.
Cons:
- Requires understanding of different storage types and their use cases.
- Modifying values can break site functionality if done incorrectly.
- Doesn't provide insight into server-side session management.
Verdict: Essential for debugging user-specific issues, understanding data persistence, and managing client-side storage. It provides a clear view of how a website remembers and interacts with its visitors.
8. Security Panel (HTTPS & Mixed Content)
The Security panel provides information about the security of the current page, primarily focusing on HTTPS status, certificate details, and mixed content warnings. For SEO, HTTPS is a fundamental ranking signal, and any security warnings can deter users and negatively impact trust. This panel helps beginners quickly identify if a page is served securely, if the SSL certificate is valid, and crucially, if there are any "mixed content" issues (where insecure HTTP resources are loaded on an otherwise secure HTTPS page). Mixed content can lead to browser warnings and a degraded user experience.
Best for: Verifying HTTPS implementation, checking SSL certificate validity, identifying mixed content warnings, ensuring secure page delivery, building user trust.
Pros:
- Clear visual indication of a page's security status.
- Detailed information about the SSL certificate.
- Highlights mixed content issues that can compromise security and user trust.
- Directly supports a core SEO ranking factor (HTTPS).
Cons:
- Doesn't diagnose server-side security vulnerabilities.
- Primarily focused on transport layer security rather than application security.
- Understanding certificate details might require some technical background.
Verdict: A quick and vital check for any website. Ensuring a secure connection is non-negotiable for user trust, data privacy, and search engine visibility, making this panel highly valuable for beginners.
9. Coverage Panel (Unused CSS/JS)
The Coverage panel identifies unused CSS and JavaScript code on a webpage. When a browser loads a page, it often downloads entire stylesheets and script files, even if only a small portion of the code is actually used. This excess code adds to load times and resource consumption. For performance optimization and SEO, reducing unused code is a direct way to improve page speed and Core Web Vitals. This panel helps beginners pinpoint specific files and code blocks that can be optimized or removed, contributing to a leaner, faster website.
Best for: Identifying render-blocking unused code, optimizing page load performance, improving Core Web Vitals, reducing overall resource size, streamlining codebases.
Pros:
- Visualizes the percentage of used vs. unused code in CSS and JS files.
- Highlights specific lines of code that are not executed.
- Directly informs decisions about code splitting, minification, and removal.
- Contributes to better page speed scores and user experience.
Cons:
- Requires careful consideration before removing code, as some might be used conditionally.
- Doesn't automatically optimize or remove code; it only identifies it.
- Can be challenging to interpret for complex, dynamic applications.
Verdict: A powerful tool for performance-minded beginners. It provides clear, actionable data for reducing bloat and improving page load times, directly impacting SEO and user satisfaction.
10. CSS Overview Panel (Style Analysis)
The CSS Overview panel provides a high-level summary of a page's CSS, including color palettes, font lists, unused declarations, and media queries. For beginners, this offers a centralized view of a site's styling, helping to identify inconsistencies, redundant styles, or opportunities for consolidation. Marketers can use it to ensure brand guidelines are consistently applied across the site by checking colors and fonts. Developers can quickly spot unused CSS rules that contribute to file bloat, improving load times and maintainability.
Best for: Auditing site-wide CSS consistency, identifying unused CSS declarations, understanding color palettes and font usage, simplifying stylesheets, improving design system adherence.
Pros:
- Centralized report on all CSS properties and values used.
- Highlights unused CSS declarations for potential removal.
- Provides a clear overview of colors and fonts for brand consistency checks.
- Useful for identifying styling inconsistencies across a site.
Cons:
- Doesn't offer direct editing capabilities; it's an audit tool.
- May require understanding of CSS specificity and inheritance to fully utilize.
- Can be less useful for highly dynamic or component-based styling.
Verdict: A valuable tool for maintaining design consistency and identifying inefficiencies in stylesheets. It's particularly useful for those focused on brand presentation and front-end performance.
Measuring Impact and Choosing Your Focus
The true value of mastering these DevTools features lies in their application to tangible site improvements. After identifying an issue—be it a slow image, a JavaScript error, or an accessibility concern—the next step is to implement a solution and then re-evaluate. Use the same DevTools panels to verify that the fix has been applied correctly and has yielded the desired outcome. For instance, after optimizing images, re-run the Network panel to confirm reduced file sizes and faster load times. After correcting mixed content, check the Security panel to ensure the "Secure" indicator is present. The iterative process of diagnose-fix-verify is where commercial value is generated. Prioritize learning the panels that address your most pressing site issues first, then gradually expand your knowledge. For an e-commerce site, performance and mobile responsiveness might be paramount. For a content-heavy blog, SEO and accessibility checks could take precedence. Consistent application and verification are key to translating DevTools insights into measurable improvements in user experience, search engine performance, and conversion rates.
FAQ
What are browser DevTools?
Browser Developer Tools are built-in web authoring and debugging tools directly accessible within web browsers. They allow web developers and site owners to inspect and modify web pages in real-time, diagnose issues, and analyze performance without needing external software.
Why should a beginner marketer or SEO professional use DevTools?
For beginners in marketing or SEO, DevTools provide direct access to critical information affecting site performance, user experience, and search engine visibility. They allow you to diagnose common issues like slow load times, broken links, unoptimized images, or unresponsive designs, which directly impact rankings and conversions, without relying solely on developers.
Are DevTools available in all browsers?
Yes, all major modern browsers (Chrome, Firefox, Edge, Safari) include their own set of developer tools, offering similar functionalities, although their interfaces and specific features may differ slightly. The core concepts and panels discussed typically have equivalents across these browsers.
Can I break my website by using DevTools?
No. Any changes you make within DevTools (e.g., in the Elements panel or Console) are only applied to your local view of the webpage in your browser. They are not saved to the live website and will disappear upon refreshing the page. DevTools are a safe environment for experimentation and debugging.
How often should I check my site with DevTools?
Regular checks are recommended, especially after making significant changes to your website (e.g., deploying new content, updating themes, installing plugins). For ongoing monitoring, a weekly or bi-weekly review of key performance and error indicators using panels like Lighthouse, Network, and Console can help catch issues early.